Catalyst / setup – Pre market SIP – Opened approx 15% up on news “Amprius (NYSE: AMPX) has been awarded up to $75M from the U.S. Department of War. The money will retrofit an existing domestic EV battery production line to make high-energy-density cells for unmanned aerial systems. The line is operated by a major South Korean manufacturer. It is planned for completion in early 2028 at 12 million Amprius cells per year, and the conversion is expected to cost about $100M including in-kind investment from Amprius and the partner.”
I took a small entry against the 5 min lows based on current price vs “The Street is already constructive: a consensus target of $23.00 across 11 analysts, a high of $33 and a low of $17. Recent actions include H.C. Wainwright reiterating Buy at $18 on Sept 22 and Northland reiterating Buy at $24 on Sept 3. Clear Street, meanwhile, trimmed its target to $30 from $33”
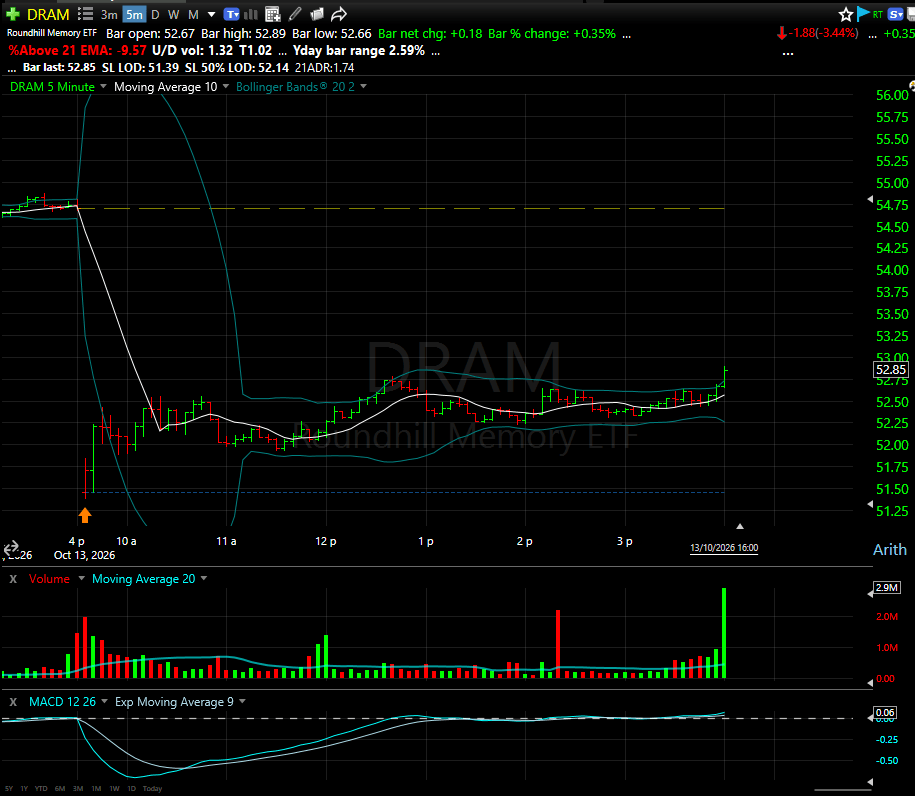
Result – Trade closed, got stopped out a few mins later @ 14:41 for 0.75 pt / 100% loss
Yesterdays market: Money leaving the market – High selling pressure
TC2000 McClellan: -80
Stocks above 40PMA T2108: 18
VIX: 16
52 week highs (US common stocks): 158
Seasonality:September is broadly weak, and midterm years make it slightly weaker. Since 1950, September averages about -0.6% across all years, but in midterm years specifically it drops to roughly -0.8%, compared to +0.9% for October and +1.9% for November in all years. Other analyses using different lookback windows put the midterm-September average anywhere from -0.82% with a win rate of just 47.4% to slightly better depending on the exact years sampled.
The bigger story is the September–October low, not September alone. Across the 19 midterm years since 1950, market lows have clustered heavily in the weeks just before the election, and the S&P 500 has been higher 12 months after every single one of those 19 midterm elections. Drawdowns in this window have ranged widely — a roughly 20% decline in 2002, a shallower pullback in 2010, ~10% in 2014, and ~11.5% in 2018.
Indices:
$SOXX Uptrend
$QQQ: Uptrend
$SPY: Uptrend
$RSP: Downtrend
$DIA: Downtrend
$IWM: Downtrend
$BTC: No trend
$SQQQ: Downtrend
$UVIX: Downtrend
$TLT: Downtrend
$USO: Downtrend
$GLD: Downtrend
$SLV: No trend
$SLX: Downtrend
2%+ sectors yesterday:
None
2%- sectors yesterday:
$TAN -2.41%
Main sectors monthly trailing:
Leading – $XLE $XLK
Lagging – $XLU $XLB
Sub sectors monthly trailing:
Leading – $SMH $HACK
Lagging – $TAN $IYT
Bitcoin: 84k ish
Themes:
Cybersecurity
Infrastructure
Cloud Computing
Semiconductors
Software
Clean energy
Crypto
THEME 1: Agentic AI CPU & Compute Squeeze:
Ticker
Company Name
Sector/Industry
Market Cap
YTD Return
Key Catalyst
Analyst Consensus
INTC
Intel Corporation
Semis – CPUs/Foundry
~$620B
~+220%
Server CPU shortage; reported 10% CPU price hikes; +17% this week
Fridays market: Money entering the market – Normal buying pressure
TC2000 McClellan: -52
Stocks above 40PMA: 20
VIX: 15
52 week highs (US common stocks): 178
Seasonality:September is broadly weak, and midterm years make it slightly weaker. Since 1950, September averages about -0.6% across all years, but in midterm years specifically it drops to roughly -0.8%, compared to +0.9% for October and +1.9% for November in all years. Other analyses using different lookback windows put the midterm-September average anywhere from -0.82% with a win rate of just 47.4% to slightly better depending on the exact years sampled.
The bigger story is the September–October low, not September alone. Across the 19 midterm years since 1950, market lows have clustered heavily in the weeks just before the election, and the S&P 500 has been higher 12 months after every single one of those 19 midterm elections. Drawdowns in this window have ranged widely — a roughly 20% decline in 2002, a shallower pullback in 2010, ~10% in 2014, and ~11.5% in 2018.
Indices:
$SOXX Uptrend
$QQQ: Uptrend
$SPY: Uptrend
$RSP: Downtrend
$DIA: Downtrend
$IWM: Downtrend
$BTC: No trend
$SQQQ: Downtrend
$UVIX: Downtrend
$TLT: Downtrend
$USO: Downtrend
$GLD: Downtrend
$SLV: No trend
$SLX: Downtrend
2%+ sectors Friday:
None
2%- sectors Friday:
$HACK -3.13%
Main sectors monthly trailing:
Leading – $XLE $XLK
Lagging – $XLU $XLB
Sub sectors monthly trailing:
Leading – $SMH $HACK
Lagging – $TAN $IYT
Bitcoin: 84k ish
Themes:
Cybersecurity
Infrastructure
Cloud Computing
Semiconductors
Software
Clean energy
Crypto
THEME 1: Agentic AI CPU & Compute Squeeze:
Ticker
Company Name
Sector/Industry
Market Cap
YTD Return
Key Catalyst
Analyst Consensus
INTC
Intel Corporation
Semis – CPUs/Foundry
~$620B
~+220%
Server CPU shortage; reported 10% CPU price hikes; +17% this week
Yesterdays market: Money leaving the market – Normal selling pressure
TC2000 McClellan: -85
Stocks above 40PMA: 20
VIX: 15
52 week highs (US common stocks): 171
Seasonality:September is broadly weak, and midterm years make it slightly weaker. Since 1950, September averages about -0.6% across all years, but in midterm years specifically it drops to roughly -0.8%, compared to +0.9% for October and +1.9% for November in all years. Other analyses using different lookback windows put the midterm-September average anywhere from -0.82% with a win rate of just 47.4% to slightly better depending on the exact years sampled.
The bigger story is the September–October low, not September alone. Across the 19 midterm years since 1950, market lows have clustered heavily in the weeks just before the election, and the S&P 500 has been higher 12 months after every single one of those 19 midterm elections. Drawdowns in this window have ranged widely — a roughly 20% decline in 2002, a shallower pullback in 2010, ~10% in 2014, and ~11.5% in 2018.
Indices:
$SOXX Uptrend
$QQQ: Uptrend
$SPY: Uptrend
$RSP: Downtrend
$DIA: Downtrend
$IWM: Downtrend
$BTC: Uptrend
$SQQQ: Downtrend
$UVIX: Downtrend
$TLT: Downtrend
$USO: Downtrend
$GLD: Downtrend
$SLV: No trend
$SLX: Downtrend
2%+ sectors yesterday:
None
2%- sectors yesterday:
$TAN -3.51%
Main sectors monthly trailing:
Leading – $XLE $XLK
Lagging – $XLU $XLB
Sub sectors monthly trailing:
Leading – $SMH $HACK
Lagging – $TAN $IYT
Bitcoin: 84k ish
Themes:
Cybersecurity
Infrastructure
Cloud Computing
Semiconductors
Software
Clean energy
Crypto
Top thematic stocks:
Ticker
Company Name
Sector/Industry
Market Cap
YTD Return
Key Catalyst
Analyst Consensus
LITE
Lumentum Holdings Inc.
Communication Equipment – Optical/Photonics
$83.2B
+151.5%
800G/1.6T optical interconnect upgrade cycle for AI data centers
Buy; PT $1,148 (+24%)
CIEN
Ciena Corp
Communication Equipment – Networking
$49.6B
+49.5%
Record $8.5B backlog (seen exceeding $10B by FY-end); Q3 beat, but margin-normalization concerns
Buy; PT $504 (+44%)
COHR
Coherent Corp
Electronic Components – Photonics/Lasers
$59.8B
+65.5%
Diversified photonics/laser exposure to optical-interconnect upgrades
Buy; PT $415 (+36%)
GLW
Corning Inc
Electronic Components – Glass/Fiber
$143.3B
+91.1%
Fiber and glass infrastructure demand from AI data center buildout
Yesterdays market: Money leaving the market – High selling pressure
TC2000 McClellan: -82
Stocks above 40PMA: 21
VIX: 15
52 week highs (US common stocks): 174
Seasonality:September is broadly weak, and midterm years make it slightly weaker. Since 1950, September averages about -0.6% across all years, but in midterm years specifically it drops to roughly -0.8%, compared to +0.9% for October and +1.9% for November in all years. Other analyses using different lookback windows put the midterm-September average anywhere from -0.82% with a win rate of just 47.4% to slightly better depending on the exact years sampled.
The bigger story is the September–October low, not September alone. Across the 19 midterm years since 1950, market lows have clustered heavily in the weeks just before the election, and the S&P 500 has been higher 12 months after every single one of those 19 midterm elections. Drawdowns in this window have ranged widely — a roughly 20% decline in 2002, a shallower pullback in 2010, ~10% in 2014, and ~11.5% in 2018.
Indices:
$SOXX Uptrend
$QQQ: Uptrend
$SPY: Uptrend
$RSP: Downtrend
$DIA: Downtrend
$IWM: No trend
$BTC: Uptrend
$SQQQ: Downtrend
$UVIX: Downtrend
$TLT: No trend
$USO: Downtrend
$GLD: No trend
$SLV: No trend
$SLX: Downtrend
2%+ sectors yesterday:
None
2%- sectors yesterday:
$TAN -3.12%
$JETS -2.99%
$IBB -2.00%
Main sectors monthly trailing:
Leading – $XLE $XLK
Lagging – $XLU $XLY
Sub sectors monthly trailing:
Leading – $SMH $HACK
Lagging – $TAN $IYT
Bitcoin: 83k ish
Themes:
Cybersecurity
Infrastructure
Cloud Computing
Semiconductors
Software
Clean energy
Crypto
Top thematic stocks:
Ticker
Company Name
Sector/Industry
Market Cap
YTD Return
Key Catalyst
Analyst Consensus
LITE
Lumentum Holdings Inc.
Communication Equipment – Optical/Photonics
$83.2B
+151.5%
800G/1.6T optical interconnect upgrade cycle for AI data centers
Buy; PT $1,148 (+24%)
CIEN
Ciena Corp
Communication Equipment – Networking
$49.6B
+49.5%
Record $8.5B backlog (seen exceeding $10B by FY-end); Q3 beat, but margin-normalization concerns
Buy; PT $504 (+44%)
COHR
Coherent Corp
Electronic Components – Photonics/Lasers
$59.8B
+65.5%
Diversified photonics/laser exposure to optical-interconnect upgrades
Buy; PT $415 (+36%)
GLW
Corning Inc
Electronic Components – Glass/Fiber
$143.3B
+91.1%
Fiber and glass infrastructure demand from AI data center buildout
Yesterdays market: Money entering the market – Normal buying pressure
TC2000 McClellan: -62
Stocks above 40PMA: 23
VIX: 15
52 week highs (US common stocks): 156
Seasonality:September is broadly weak, and midterm years make it slightly weaker. Since 1950, September averages about -0.6% across all years, but in midterm years specifically it drops to roughly -0.8%, compared to +0.9% for October and +1.9% for November in all years. Other analyses using different lookback windows put the midterm-September average anywhere from -0.82% with a win rate of just 47.4% to slightly better depending on the exact years sampled.
The bigger story is the September–October low, not September alone. Across the 19 midterm years since 1950, market lows have clustered heavily in the weeks just before the election, and the S&P 500 has been higher 12 months after every single one of those 19 midterm elections. Drawdowns in this window have ranged widely — a roughly 20% decline in 2002, a shallower pullback in 2010, ~10% in 2014, and ~11.5% in 2018.
Indices:
$SOXX Uptrend
$QQQ: Uptrend
$SPY: No trend
$RSP: Downtrend
$DIA: Downtrend
$IWM: Downtrend
$BTC: Uptrend
$SQQQ: Downtrend
$UVIX: No trend
$TLT: No trend
$USO: No trend
$GLD: No trend
$SLV: No trend
$SLX: Downtrend
2%+ sectors yesterday:
$SMH +4.02%
$HACK +3.63%
$JETS +2.80%
$XLK +2.77%
$IGV +2.66%
$TAN +2.30%
2%- sectors yesterday:
$XLE -2.88%
Main sectors monthly trailing:
Leading – $XLE $XLK
Lagging – $XLU $XLI
Sub sectors monthly trailing:
Leading – $SMH $HACK
Lagging – $TAN $IYT
Bitcoin: 86k ish
Themes:
Cybersecurity
Infrastructure
Cloud Computing
Semiconductors
Software
Clean energy
Crypto
Top thematic stocks:
Ticker
Company Name
Sector/Industry
Market Cap
YTD Return
Key Catalyst
Analyst Consensus
LITE
Lumentum Holdings Inc.
Communication Equipment – Optical/Photonics
$83.2B
+151.5%
800G/1.6T optical interconnect upgrade cycle for AI data centers
Buy; PT $1,148 (+24%)
CIEN
Ciena Corp
Communication Equipment – Networking
$49.6B
+49.5%
Record $8.5B backlog (seen exceeding $10B by FY-end); Q3 beat, but margin-normalization concerns
Buy; PT $504 (+44%)
COHR
Coherent Corp
Electronic Components – Photonics/Lasers
$59.8B
+65.5%
Diversified photonics/laser exposure to optical-interconnect upgrades
Buy; PT $415 (+36%)
GLW
Corning Inc
Electronic Components – Glass/Fiber
$143.3B
+91.1%
Fiber and glass infrastructure demand from AI data center buildout
Catalyst / setup – Event Sept 8th took cheap calls as normally rises into event a AI air pods possible leaked, theme AI
Result: Runnerrunning – Closed 50% @ 278 11/09/26 15:46 and closed another 50% @ 315 11/09/26 16:15, I used the pop after the $AAPL event to scale out as the option expires 18/09/26, runner left running.
Update: Runner expired on Friday 18/09/2026 at 0 resulting in small loss on the position resulting in overall trade approx +100%
Fridays market: Money entering the market – Normal buying pressure
TC2000 McClellan: -86
Stocks above 40PMA: 24
VIX: 15
52 week highs (US common stocks): 181
Seasonality:September is broadly weak, and midterm years make it slightly weaker. Since 1950, September averages about -0.6% across all years, but in midterm years specifically it drops to roughly -0.8%, compared to +0.9% for October and +1.9% for November in all years. Other analyses using different lookback windows put the midterm-September average anywhere from -0.82% with a win rate of just 47.4% to slightly better depending on the exact years sampled.
The bigger story is the September–October low, not September alone. Across the 19 midterm years since 1950, market lows have clustered heavily in the weeks just before the election, and the S&P 500 has been higher 12 months after every single one of those 19 midterm elections. Drawdowns in this window have ranged widely — a roughly 20% decline in 2002, a shallower pullback in 2010, ~10% in 2014, and ~11.5% in 2018.
Indices:
$SOXX Uptrend
$QQQ: Uptrend
$SPY: Downtrend
$RSP: Downtrend
$DIA: Downtrend
$IWM: Downtrend
$BTC: Uptrend
$SQQQ: Downtrend
$UVIX: No trend
$TLT: No trend
$USO: Uptrend
$GLD: No trend
$SLV: No trend
$SLX: Downtrend
2%+ sectors Friday:
$SMH +2.21%
2%- sectors Friday:
None
Main sectors monthly trailing:
Leading – $XLE $XLK
Lagging – $XLU $XLI
Sub sectors monthly trailing:
Leading – $IGV $HACK
Lagging – $TAN $JETS
Bitcoin: 82k ish
Themes:
Cybersecurity
Infrastructure
Cloud Computing
Semiconductors
Software
Clean energy
Crypto
Top thematic stocks:
Ticker
Company Name
Sector/Industry
Market Cap
YTD Return
Key Catalyst
Analyst Consensus
LITE
Lumentum Holdings Inc.
Communication Equipment – Optical/Photonics
$83.2B
+151.5%
800G/1.6T optical interconnect upgrade cycle for AI data centers
Buy; PT $1,148 (+24%)
CIEN
Ciena Corp
Communication Equipment – Networking
$49.6B
+49.5%
Record $8.5B backlog (seen exceeding $10B by FY-end); Q3 beat, but margin-normalization concerns
Buy; PT $504 (+44%)
COHR
Coherent Corp
Electronic Components – Photonics/Lasers
$59.8B
+65.5%
Diversified photonics/laser exposure to optical-interconnect upgrades
Buy; PT $415 (+36%)
GLW
Corning Inc
Electronic Components – Glass/Fiber
$143.3B
+91.1%
Fiber and glass infrastructure demand from AI data center buildout
Yesterdays market: Money entering the market – High buying pressure
TC2000 McClellan: -63
Stocks above 40PMA: 26
VIX: 15
52 week highs (US common stocks): 184
Seasonality:September is broadly weak, and midterm years make it slightly weaker. Since 1950, September averages about -0.6% across all years, but in midterm years specifically it drops to roughly -0.8%, compared to +0.9% for October and +1.9% for November in all years. Other analyses using different lookback windows put the midterm-September average anywhere from -0.82% with a win rate of just 47.4% to slightly better depending on the exact years sampled.
The bigger story is the September–October low, not September alone. Across the 19 midterm years since 1950, market lows have clustered heavily in the weeks just before the election, and the S&P 500 has been higher 12 months after every single one of those 19 midterm elections. Drawdowns in this window have ranged widely — a roughly 20% decline in 2002, a shallower pullback in 2010, ~10% in 2014, and ~11.5% in 2018.
Indices:
$SOXX No trend
$QQQ: No trend
$SPY: Downtrend
$DIA: Downtrend
$IWM: Downtrend
$BTC: No trend
$SQQQ: No trend
$UVIX: No trend
$TLT: No trend
$GLD: Downtrend
$SLV: No trend
$SLX: Downtrend
2%+ sectors yesterday:
$TAN +3.90%
$SMH +2.76%
$IBB +2.31%
$XLK +2.25%
2%- sectors yesterday:
None
Main sectors monthly trailing:
Leading – $XLE $IBB
Lagging – $XLU $XLI
Sub sectors monthly trailing:
Leading – $IGV $HACK
Lagging – $TAN $JETS
Bitcoin: 78k ish
Themes:
Cybersecurity
Infrastructure
Cloud Computing
Semiconductors
Software
Clean energy
Crypto
Top thematic stocks:
Ticker
Company Name
Sector/Industry
Market Cap
YTD Return
Key Catalyst
Analyst Consensus
LITE
Lumentum Holdings Inc.
Communication Equipment – Optical/Photonics
$83.2B
+151.5%
800G/1.6T optical interconnect upgrade cycle for AI data centers
Buy; PT $1,148 (+24%)
CIEN
Ciena Corp
Communication Equipment – Networking
$49.6B
+49.5%
Record $8.5B backlog (seen exceeding $10B by FY-end); Q3 beat, but margin-normalization concerns
Buy; PT $504 (+44%)
COHR
Coherent Corp
Electronic Components – Photonics/Lasers
$59.8B
+65.5%
Diversified photonics/laser exposure to optical-interconnect upgrades
Buy; PT $415 (+36%)
GLW
Corning Inc
Electronic Components – Glass/Fiber
$143.3B
+91.1%
Fiber and glass infrastructure demand from AI data center buildout
Are breakouts likely to work for the next 3 – 5 days: No
Are breakdowns likely to work for the next 3 – 5 days: No
Should I be trading: Indices in downtrends apart from $QQQ which is in no trend, 20% study got a pop on the bullish side 34 v 8 after a +382 day in the bullish 4% movers.
Patience to see if this is the start of a move or just more chop which is what it feels like at the moment.
SIPs & EP9’s with strong CATs main focus.
Todays watchlist (stocks setting up): Nothing at the moment
Catalyst / setup – SoS / momoburst – Circle Internet Group stock surged more than 12% Wednesday as investors returned to crypto-linked equities amid renewed regulatory activity in Washington and a broader rebound across cryptocurrency markets. Trump hosted crypto execs + SEC/CFTC chairs at the White House.
Result – Trade finished – SIP momo burst so closed 50% at 1% move at 76.55 14:33, and another 50% at 2% at 77.06 14:35, runner left on.
Took another 50% off on todays 10% pop and day 3 of a swing 21/08/2026 14:54 @ 91.20
Final update: 17/09/2026: Runner stopped out 16/09/2026 @ 81.44, fully closed for +142%
Notes – Didnt know the catalyst when entered the trade but was in my watchlist, was looking powerful pre market and flew out the gate, 75% scaled in 3 mins. Stop raised to just above break even.